- McKinnon Prize survey says majority of Australians fault the way State and Federal governments handled the COVID-19 response
- According to the survey, the most dissatisfied state under the topics of vaccinations, border closures, quarantines and the national cabinet is New South Wales
- The survey shows 15 per cent of Australians believe politicians acted better than expected. The February data showed nearly half the population believed so
- According to the survey, “44 per cent of metropolitan respondents voted for major parties, compared to 32 per cent of regional respondents”
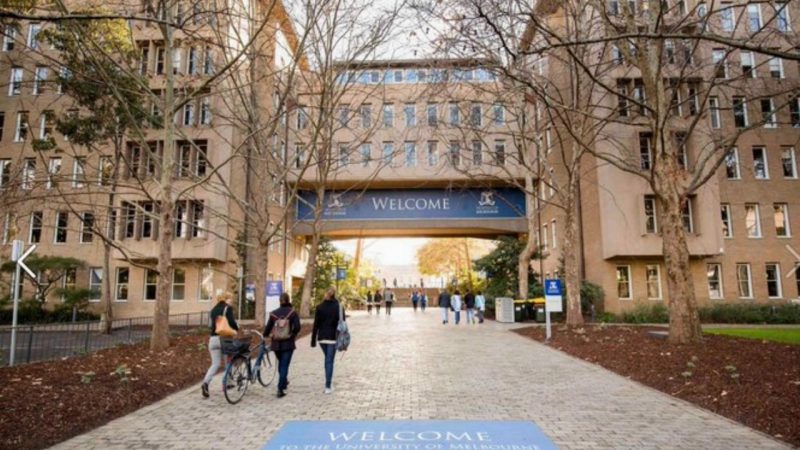
As part of Melbourne University, the McKinnon Foundation survey has found the majority of Australians found faults in the way State and Federal governments handled the COVID-19 response.
The survey measured divided voting patterns, government collaborations, traditional news consumption and government pandemic response.
State of Disappointment
According to the survey, the most dissatisfied state under the topics of vaccinations, border closures, quarantines and the national cabinet was New South Wales.
An estimated 32 per cent of people were disappointed with the State’s actions under the aforementioned categories.
Closely following was the state with the world’s longest lockdown; Victoria, with 29 per cent of the population dissatisfied with the actions of their state.
Melbourne has spent a total of nearly nine months in lockdown in the past year and a half.
The most satisfied state under the same measures was South Australia, with a total score of 94 per cent satisfaction.
Political pandemic response
“Over the past 12 months, 40 per cent of Australians believe our political leaders performed worse than they would have expected compared to 17.5 per cent in February,” the survey found.
As well as the disapproval rates above, NSW listed a 17 per cent increase in the number of people who believed political leaders acted worse than they expected.
The survey showed 15 per cent of Australians believed politicians acted better than expected. The February data showed nearly half the population believed so.
Each state has gone into lockdown in the past five months from various Delta outbreaks, leaving more room for criticisms from their residents.
Regions versus metro
The survey also measured the voter disparities between regional and metropolitan voters, claiming regional voters were less likely to vote for the major parties.
According to the survey, “44 per cent of metropolitan respondents voted for major parties, compared with 32 per cent of regional respondents.”
With “19 per cent of rural respondents voting for an independent party, compared with less than four per cent in metropolitan respondents”.

