


Join our daily newsletter At The Bell to receive exclusive market insights
Market Mood
In this edition of Moves and Moods, we introduce a useful tool for the end of financial year, when investors typically clear the decks of loss-making positions. This is tax-driven behaviour. In any year where investors booked capital gains, they may choose to offset these by selling losers. The deductible loss is of greatest value when it is a short-term loss, with a holding period of less than one year.
Going back over twenty years, I developed a handy indicator to monitor those stocks most likely to be sold down due to heavy unrealized losses among shareholders. There is a simple rule that you can use to estimate the average cost of entry of investors in common stocks. I call this the cost-basis effect, and the rule is based on using publicly available trading data on price and volume.
I will give a short intuitive explanation.
Suppose you could spy on the shareholder register of a company. Then you could assign each share of the company to an owner, and the price at which they bought the shares. We cannot really do that, but we do know the possible prices. Current owners must have bought at some time, and the only possible prices are those at which the company traded. Moreover, where the company had a large volume of shares traded, it is more likely that current stockholders own some bought then.
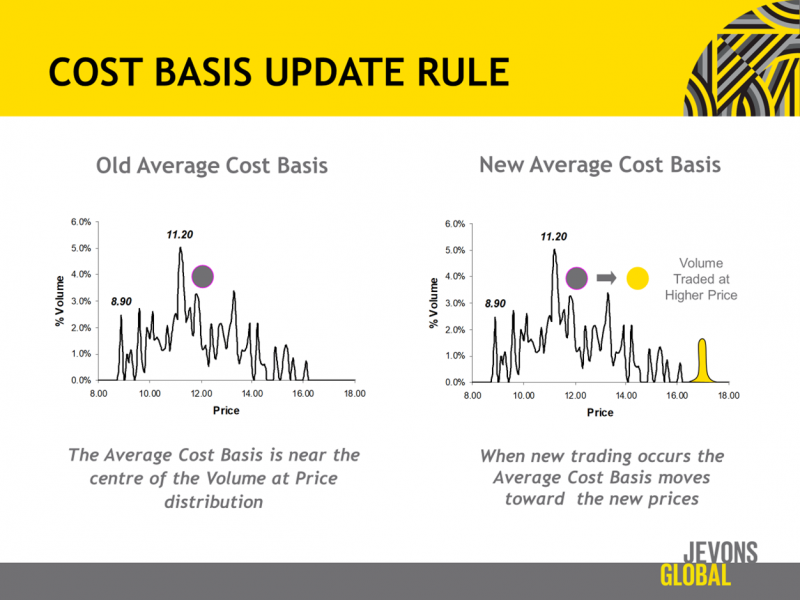
Reflecting on this fact, the simplest possible cost-of-entry estimate would be to add up all volume that was every traded at some price, and then graph that for all prices, Figure 1. This is called a volume at price chart and is shown at below. However, we can do better by thinking through how to update the figure, when new trade data arrives This is simply a case of adding a new peak centered on the new trade price, with a height equal to the proportion of total shares traded. Of course, the old data has to be haircut by a factor which makes the total area under the graph sum to one.
Investment Opportunity
The resulting cost-basis curve can be averaged to get the typical cost of entry. Obviously, if the price today is above that level, then most investors are in profit. Otherwise, they carry a loss. If you ponder your own reaction when reviewing the red ink in a broker report, you can see why this matters.
When most investors carry unrealized losses, they will be unhappy campers.
When the end of financial year comes around, many will sell.
Here is a chart of the distribution of unhappy campers by size of company, and sector Figure 2.\
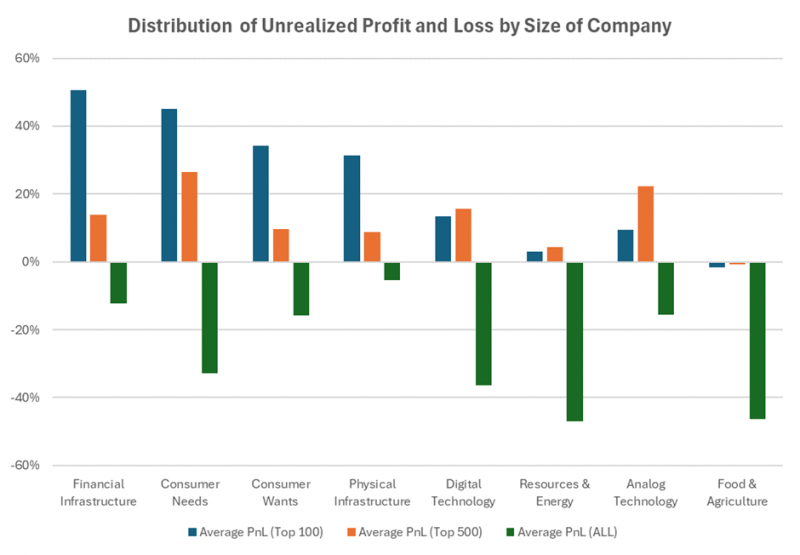
There have been good conditions for large-cap financials, healthcare, and retail stocks. These stocks have unrealized profits greater than 30%. The opposite is true of small resource stocks, and farming, or food processing and retail stocks. The obvious conclusion is that profits will likely have been taken in the winners over the course of the financial year. Now the obvious counter move is for those investors with gains to sell losers to reduce their capital gains tax liability.
Move for This Mood
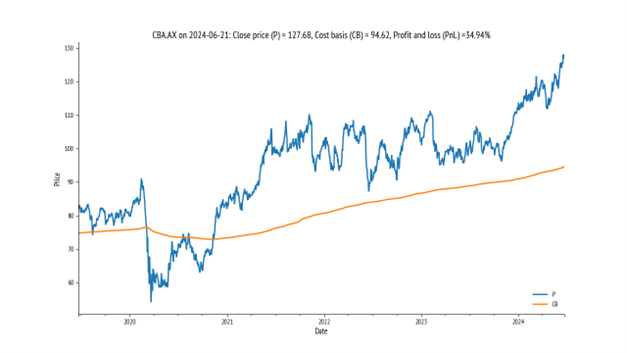
This time of year, you will typically see the large winning sectors outperform the large losing sectors due to the statistical effect of tax loss selling. Ordinarily, the capital gains have been taken already, as there is no reason to sell ongoing winners to produce a taxable event.
For instance, you can see that Commonwealth Bank ASX: CBA, is still surging, Figure 3.
However, the opposite effect occurs in large losers like IGO Ltd ASX: IGO, .Figure 4.
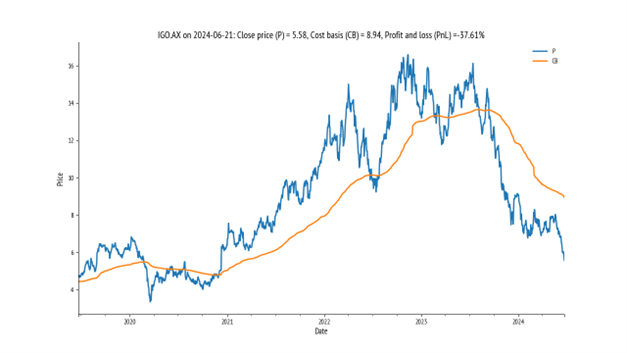
On the bright side, although investors may feel like drowning their sorrows over the miserable performance of critical minerals stocks this June, rest assured that the Ides of June will pass.
Optimism is the secret sauce of all successful investors when faced with a calamity.
Lithium, nickel and rare earth prices are all in the dumps right now, and so are the stocks.
However, don’t place too much weight on the recent three week selling crescendo as this is likely down to an extreme year for tax loss selling. There were some great profits made earlier in the speculative explorers, and investors in critical minerals stocks are now squaring up their tax liabilities.
The move for this mood is to download the latest quarterly production reports. Scrutinise the recent news flow, and see which companies are set up for a good second half of this calendar year. Look out for fresh data on All-in-Sustaining Cost of Production, and fresh drill programs.
The mood for this move, is to stay focused and look for great buys in the EOFY bargain bin.
For more information, you can follow the Savvy Yabby Report.
Disclaimer: This article contains information and educational content provided by Jevons Global Pty Ltd, a Corporate Authorised Representative (AR1250727) of BR Securities Australia Pty Ltd (ABN 92 168 734 530) which holds an Australian Financial Services License (AFSL 456663). The Market Online does not operate under a financial services licence and relies on the exemption available under section 911A(2)(eb) of the Corporations Act 2001 (Cth) in respect of any advice given.
The information is intended to be general in nature and is not personal financial advice. It does not take into account your personal financial situation or objectives and you should consider consulting a qualified financial professional before making any investment decision. All brands and trademarks included in this report remain the property of their owners.
The material provided in this article is for information only and should not be treated as investment advice. Viewers are encouraged to conduct their own research and consult with a certified financial advisor before making any investment decisions. For full disclaimer information, please click here.